
What Is Gradebot?
Gradebot is an AI grading assistant built by professors to give instructors rubric-aligned, defensible grades in a fraction of the time. Instructors bring their own rubric — or generate one from an assignment prompt — and Gradebot drafts a per-criterion score, performance level, and written feedback for every submission, with its reasoning shown alongside the work. Nothing reaches a student until the teaching team reviews and approves it: confidence flags surface the drafts worth a closer look, and every score and comment stays editable before it's published.
The platform is designed to align with FERPA from day one: student submissions are never used to train AI models, remain private and institution-controlled, and are deleted on a 180-day default retention schedule. Gradebot works across virtually any subject — from essays to equations — and integrates directly with Canvas for rubric import and one-click grade publishing. It's currently used by instructors at institutions including UC Irvine, USC, Columbia, NYU, Pepperdine, and LMU.
Learn more at Gradebot
Overview
Grading software can't just claim to be accurate — it has to prove it, even when there's no perfect answer key to check against. This post breaks down the test harness behind Gradebot: first the foundational V-Model testing that validated our multi-agent pipeline end to end, then ART (Adaptive Robustness Test), the custom framework we built to evaluate grading quality across five semantic dimensions — rank alignment, semantic distance, explainability, rubric alignment, and study guide alignment. We walk through ART's three adaptive scenarios for handling different levels of expert data, share head-to-head results from Gradebot vs. GPT-5, and lay out what we learned iterating across grade levels and subjects — including a catastrophic failure case that GPT-5 hit and Gradebot didn't. If you want the short version: our testing shows Gradebot grades as reliably as a human, with the receipts to back it up.
When you're building an AI system that grades student work, "trust me, it works" isn't good enough. Grades affect real students, real transcripts, and real opportunities. So before we called Gradebot market-ready, we asked ourselves a harder question: how do you rigorously test an AI grader when the "right answer" for a subjective essay or an open-ended lab report often doesn't exist?
This post walks through the test harness we built to answer that question — from our foundational software testing through ART (Adaptive Robustness Test), the custom evaluation framework we designed specifically for automated grading systems.
Why Standard Testing Wasn't Enough
Most software testing assumes a deterministic, verifiable output. Grading doesn't work that way. A single assignment can have:
● No single "correct" score — human graders themselves disagree
● Rationales that are right in substance but phrased differently than an expert would phrase them
● Wildly different amounts of available reference data — sometimes we have a full rubric and expert-scored gold standard, sometimes just a rough sense of "this submission should land in the B range"
A grading system that only gets tested against one gold-standard dataset is a grading system that's only validated for one narrow scenario. We needed something more adaptive.
The V-Model Foundation
Before touching evaluation metrics, we ran Gradebot through a traditional V-Model testing process to validate the plumbing:
● Unit & component testing — each of Gradebot's four agents (Rubric Creator, Rubric Validator, Assignment Grader, Evaluator/Refiner) tested in isolation
● Integration testing — verifying that the output of one agent is a clean, valid input for the next, end to end
This gave us confidence the multi-agent pipeline was structurally sound before we started asking the harder question: is it actually grading well?
Enter ART: Adaptive Robustness Test
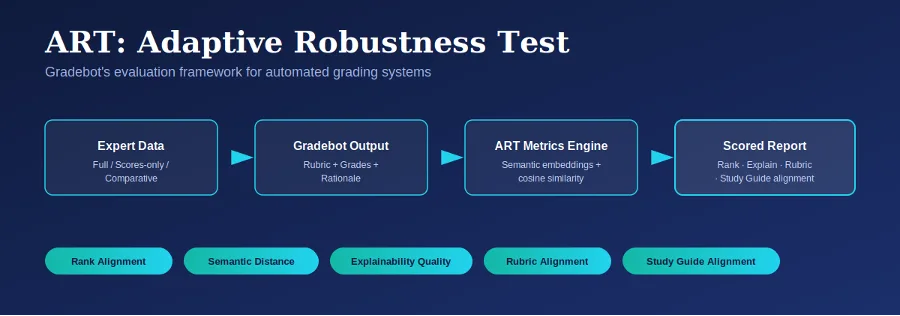
That's where ART comes in. ART is a flexible evaluation framework built specifically to handle the reality that not every grading scenario comes with the same quality or quantity of expert reference data. Instead of forcing every test into a single rigid comparison, ART adapts its measurement approach based on what's actually available.
Three Evaluation Scenarios
No | Scenario | Expert Input Available | What Gradebot Provides | What Gets Measured |
1 | Full Expert Data | Scores + detailed rationales | Grades & rationale per question/assignment | Rank alignment, semantic distance, explainability delta, rubric alignment, (optional) study guide alignment |
2 | Scores Only | Scores or student performance category (e.g., B/A/P) | Rubric + grades & rationale | Rank alignment, explainability quality, rubric alignment, (optional) study guide alignment |
3 | Comparative | Expert/synthetic scores + a competing LLM's output | Rubric + grades & rationale | Rank alignment, explainability quality, study guide alignment, rubric alignment |
This tiered structure means we can validate Gradebot even in the messy, real-world case where a school hands us a stack of assignments with no formal answer key — we just adapt which metrics we lean on most.
The Five Core Metrics
Each scenario draws on a shared toolkit of metrics, all built on Azure OpenAI embeddings (text-embedding-3-small by default, text-embedding-3-large when a run needs the extra resolution) rather than brittle keyword matching:
1. Rank Alignment — how close Gradebot's numeric score lands to the expected score.
Rank Alignment = 1 - |System Score - Expected Score| / 100
A perfect match scores 1.0; a wildly off score approaches 0.0.
2. Semantic Distance — cosine similarity between Gradebot's rationale and an expert's rationale, so we're comparing meaning, not exact wording.
3. Explainability Quality — a composite score across specificity, constructiveness, clarity, and appropriate length, so we can distinguish genuinely useful feedback ("Incorrect — you switched the sign on gravitational acceleration in step 2") from generic filler ("Incorrect").
4. Rubric Alignment — semantic similarity between Gradebot's rationale and the rubric criteria themselves, confirming the feedback is actually tied to what was supposed to be graded.
5. Study Guide Alignment (optional) — semantic similarity between Gradebot's rationale and course reference material, when available.
Where the Expected Score Comes From
For synthetic test assignments, we don't just guess at what score a submission "should" get — we compute it from a structured Error Type Table that defines, for each error category (Incomplete, Inconsistent, Invalid, Clarity, Explanation), what degree of error should map to what score:
Expected Score = Base Score − ((100 − Degree) / 100 × Penalty)
This lets us generate large batches of synthetic submissions with a known, defensible ground truth — without needing an instructor to hand-score hundreds of fake assignments.
Test Results
Testing Scenario 1: Gradebot (V2.0) vs. GPT-5, Head to Head
One of our clearest early results came from directly pitting Gradebot against a general-purpose competing LLM (GPT-5) on the same test case, across two rounds of scale:
45 assignments:
Dimension | Gradebot | GPT-5 | Winner |
Rank Alignment | 0.871 | 0.760 | Gradebot |
Explainability | 0.735 | 0.227 | Gradebot |
Study Guide Alignment | 0.208 | 0.077 | Gradebot |
Total Wins | 39 / 45 | 6 / 45 | Gradebot |
63 assignments:
Dimension | Gradebot | GPT-5 | Winner |
Rank Alignment | 0.848 | 0.793 | Gradebot |
Explainability | 0.732 | 0.223 | Gradebot |
Study Guide Alignment | 0.213 | 0.084 | Gradebot |
Total Wins | 55 / 63 | 8 / 63 | Gradebot |
The most striking finding wasn't a metric at all — it was a catastrophic failure case: GPT-5 scored a blank student submission at 95/100. Gradebot had zero catastrophic failures of this kind across the same test set. For any system meant to sit in a real classroom, that gap matters more than a few points of average accuracy.
Testing Scenario 2: Gradebot V2.0 Iteration Results Across Grade Levels and Subjects
We ran Gradebot across a wide spread of synthetic test cases spanning elementary through graduate level, and across subjects from science and history to finance and computer science.
Iteration 2 results, Gradebot V2.0 (GPT-4.1 Mini).
Test Case | Grade Level | Subject | Type | # Assign. | # Qs | Rank Align. | Explain. | Study Guide | Rubric Align. |
TestCase1 | Elementary | Science | Non-Synthetic | 7 | 21 | 0.848 | 0.732 | 0.213 | — |
TestCase15 | Middle School | History | Synthetic | 16 | 48 | 0.732 | 0.845 | 0.648 | 0.721 |
TestCase16 | Middle School | Geography | Synthetic | 16 | 48 | 0.721 | 0.866 | 0.696 | 0.743 |
TestCase9 | High School | History | Synthetic | 16 | 48 | 0.884 | 0.807 | 0.758 | 0.739 |
TestCase12 | High School | Admissions | Synthetic | 16 | 48 | 0.874 | 0.746 | 0.730 | 0.748 |
TestCase14 | High School | Mathematics | Synthetic | 16 | 48 | 0.749 | 0.719 | 0.681 | 0.709 |
TestCase17 | High School | English | Synthetic | 16 | 48 | 0.793 | 0.858 | 0.640 | 0.735 |
TestCase18 | High School | Economics | Synthetic | 16 | 48 | 0.779 | 0.843 | 0.560 | 0.711 |
TestCase19 | High School | Computer Science | Synthetic | 16 | 48 | 0.464 | 0.807 | 0.700 | 0.684 |
TestCase20 | High School | Chemistry | Synthetic | 16 | 48 | 0.806 | 0.745 | 0.679 | 0.754 |
TestCase21 | High School | Biology | Synthetic | 16 | 48 | 0.747 | 0.765 | 0.754 | 0.732 |
TestCase10 | Undergraduate | Economics | Synthetic | 16 | 48 | 0.860 | 0.853 | 0.687 | 0.761 |
TestCase13 | Undergraduate | Accounting | Synthetic | 16 | 48 | 0.842 | 0.793 | 0.609 | 0.793 |
TestCase11 | Graduate | Finance | Synthetic | 16 | 48 | 0.979 | 0.832 | 0.703 | 0.760 |
Overall | 215 | 645 | 0.789 | 0.807 | 0.654 | 0.738 |
TestCase9 reflects an average of two measurement runs on that assignment set.
Testing Scenario 3: Gradebot V3.3 Results Across Grade Levels and Subjects
Rank Alignment reflects our August 2026 audited test set (110 graded submissions across 18 assignment sets, current production system).
Test Case | Grade Level | Subject | Type | # Assign. | # Qs | Rank Align. | Explain. | Study Guide | Rubric Align. |
TestCase1 | Elementary | Science | Non-Synthetic | 6 | 18 | 0.885 | 0.788 | — | 0.777 |
TestCase15 | Middle School | History | Synthetic | 7 | 21 | 0.911 | 0.648 | 0.704 | 0.730 |
TestCase16 | Middle School | Geography | Synthetic | 7 | 21 | 0.931 | 0.757 | 0.727 | 0.785 |
TestCase9 | High School | History | Synthetic | 7 | 21 | 0.913 | 0.789 | 0.775 | 0.800 |
TestCase12 | High School | Admissions | Synthetic | 7 | 21 | 0.910 | 0.774 | 0.781 | 0.751 |
TestCase14 | High School | Mathematics | Synthetic | 7 | 21 | 0.928 | 0.682 | 0.665 | 0.737 |
TestCase17 | High School | English | Synthetic | 6 | 18 | 0.924 | 0.762 | 0.712 | 0.761 |
TestCase18 | High School | Economics | Synthetic | 7 | 21 | 0.906 | 0.754 | 0.678 | 0.720 |
TestCase19 | High School | Computer Science | Synthetic | 3 | 9 | 0.935 | 0.710 | 0.619 | 0.716 |
TestCase20 | High School | Chemistry | Synthetic | 7 | 21 | 0.917 | 0.778 | 0.696 | 0.744 |
TestCase21 | High School | Biology | Synthetic | 5 | 15 | 0.904 | 0.699 | 0.688 | 0.718 |
TestCase22 | High School | Art | Synthetic | 3 | 9 | 0.925 | 0.777 | 0.681 | 0.706 |
TestCase23 | High School | Physics | Synthetic | 7 | 21 | 0.923 | 0.758 | 0.669 | 0.729 |
TestCase10 | Undergraduate | Economics | Synthetic | 7 | 21 | 0.896 | 0.704 | 0.714 | 0.774 |
TestCase13 | Undergraduate | Accounting | Synthetic | 7 | 70 | 0.791 | 0.795 | — | 0.750 |
TestCase11 | Graduate | Finance | Synthetic | 7 | 21 | 0.915 | 0.805 | 0.783 | 0.774 |
Overall | 100 | 349 | 0.906 | 0.750 | 0.712 | 0.751 |
Testing Scenario 4: Gradebot V3.3 vs. Terra
Grade Level | Subject | Gradebot V3.3Rank Alignment | TerraRank Alignment | Difference |
Elementary | Science | 0.885 | 0.848 | -0.037 |
Middle School | History | 0.911 | 0.914 | +0.003 |
Middle School | Geography | 0.931 | 0.938 | +0.007 |
High School | History | 0.913 | 0.914 | +0.001 |
High School | Admissions | 0.910 | 0.919 | +0.009 |
High School | Mathematics | 0.928 | 0.914 | -0.014 |
High School | English | 0.924 | 0.932 | +0.008 |
High School | Economics | 0.906 | 0.904 | -0.002 |
High School | Computer Science | 0.935 | 0.932 | -0.003 |
High School | Chemistry | 0.917 | 0.920 | +0.003 |
High School | Biology | 0.904 | 0.900 | -0.004 |
High School | Art | 0.925 | 0.921 | -0.004 |
High School | Physics | 0.923 | 0.911 | -0.012 |
Undergraduate | Economics | 0.896 | 0.896 | 0.000 |
Undergraduate | Accounting | 0.791 | 0.795 | +0.004 |
Graduate | Finance | 0.915 | 0.904 | -0.011 |
Overall | 0.906 | 0.902 | -0.004 |
What We Learned Between Iterations
Testing wasn't a one-shot exercise — each iteration surfaced concrete ways to sharpen accuracy:
1. Formula hygiene — re-checking every scoring and Expected Score formula for arithmetic errors.
2. Error-type coverage — expanding the Error Type Table so every realistic failure mode (incomplete, inconsistent, invalid, unclear, under-explained) is represented.
3. Rubric alignment as a leading indicator — we found rubric alignment correlates strongly with expected score, which let us refine the Expected Score formula's two key drivers: degree of error and penalty level.
4. Prompt refinement — including grade level and subject context directly in the system prompt for both the Rubric Creator and Assignment Grader agents, and using structured JSON validation rather than relying on prompt-only formatting.
5. Study guide weighting — when a study guide is available, using alignment strength to directly inform rubric scoring bands (e.g., 0.8–1.0 alignment → Excellent, 0.6–0.79 → Above Average, and so on down to 0.0–0.19 → Low).
Why This Matters
This test harness isn't just an academic exercise — it's the backbone of the accuracy claims in Gradebot's product: grading performance on par with human graders, verified across grade levels from elementary through graduate school. Because ART is adaptive, we can keep validating Gradebot the same rigorous way even as we onboard new institutions with wildly different amounts of expert data — a school with decades of graded assignments and one running its first pilot both get the same standard of evidence.
Grading systems that can't show their work don't deserve a classroom's trust. ART is how we earn it.
Ready to See Gradebot in Action?
Accuracy claims are easy to make and hard to prove — we built ART with Gradebot so ours don't have to be taken on faith. Whether you're an institution evaluating Gradebot for your own classrooms, or a fellow builder curious about testing generative AI systems responsibly, we'd love to show you the numbers behind the numbers.
Request a Gradebot demo — Gradebot-demo-link
Get in touch with our team —Email us at amanda@gradebot.ai or admin@gradebot.ai or Call us 1-949-781-9165
Have questions about our testing methodology or want to see Gradebot in Action ? Reach out — we're happy to walk through it.